A. Planning
- Define The Data: The data provided is about houses in New York, the address, locality, sub locality, street names, broker details and locational details like longitude and latitude
- Columns in Table:
- Broker Details: BROKERTITLE
- Property: TYPE, BEDS, BATH, PROPERTYSQFT
- Price: PRICE
- Address: ADDRESS, STATE, MAIN_ADDRESS, ADINISTRATIVE_AREA_LEVEL_2, LOCALITY, SUBLOCALITY, STREET_NAME, LONG_NAME, FORMATTED_ADDRESS
- Location: LATITUDE, LONGITUDE
- Brokers:
- Key Objectives:
- To ensure that as a broker I am marking the properties at the right amount
- To Understand the price ranges based on location and type of properties
- Identify location> type of property > amenities making maximum prices
- KPIs:
- Properties Vs Location Vs Price
- Location Vs Property Vs Price
- Key Objectives:
- People searching to buy Properties:
- Key Objectives:
- To Understand the price ranges based on location and type of properties
- Search properties by location
- To identify the brokers suitable for a particular price range
- KPIs:
- Location Vs Property Vs Price
- Property Vs Location
- Location Vs Brokers Vs Property
- Key Objectives:
- Policy Makers:
- Key Objectives:
- To Understand the price ranges of properties based on locality and amenities
- To identify the brokers and the type of property they are promoting
- KPIs:
- Location Vs Property Vs Price
- Brokers Vs Property Vs Price
- Key Objectives:
B. Data Transformations
- Removing “Brokered by” from “BROKERTITLE”.
- For Address, we are keeping – “STATE”,” LOCALITY”, ”SUBLOCALITY”, ”STREET_NAME”.
C.1. Dashboard for Brokers:

Dashboard Widgets
1. Location Map:
- Plotting Latitude and Longitudinal data of properties along with the count of properties in each location.
- Purpose: To display a geographic spread of properties
- Insights Derived Visually:
- Majority of the properties are located in Manhattan.

2. Location-wise price of Properties
- The widget represents the location wise price ranges of various types of properties.
- Purpose of the widget:
- To identify the price differences between different types of properties in different regions
- Also to understand the range of average Sqft, average number of Beds and Baths of various types of properties in different localities.

3. Broker List & list of properties
- The widget lists all brokers and their corresponding properties.
- On filtering the search results based on locality and sub-locality, the brokers from the corresponding locations will be listed along with their properties.

4. Card Metrics

- Based on the selected locality, the above cards represent the count of brokers, Average Price, Average SQFt and Average number of properties from that locality.
5. Property Type Count
- The widget shows the % of properties belonging to each property type.

C.2. Dashboard for Tenants/ Buyers

Dashboard Widgets
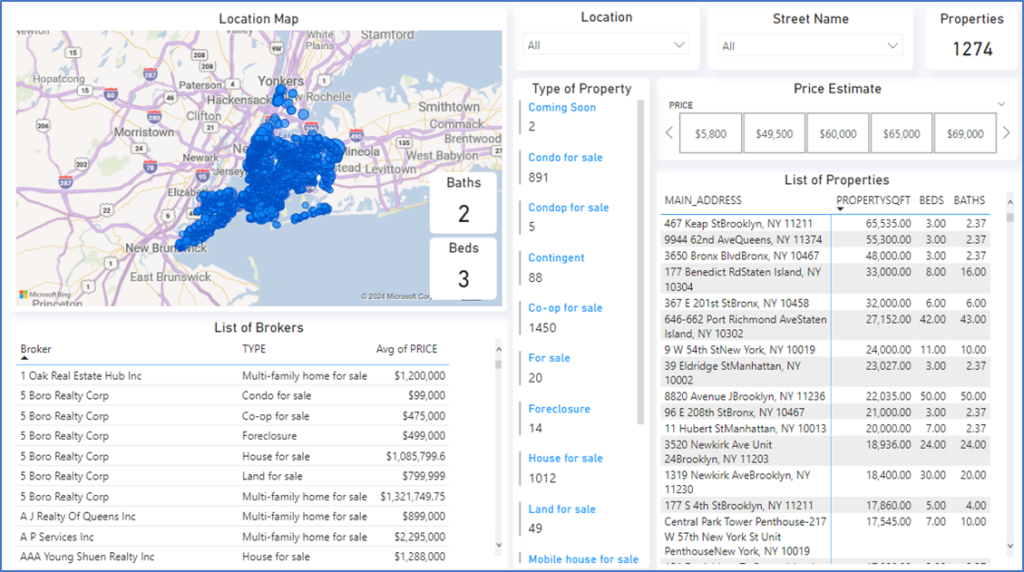
- Location Map: Same as the location map in “Broker’s Panel”
- List of Brokers: Same as the List of Brokers in “Broker’s Panel”
- Type of Property:
- Multi-row card is used to list the count of different types of properties

4. Price Estimate:
- This widget is a slicer which users can use to select properties based on price.
5. List of Properties:
- Corresponding to each property, the property amenities, Sqft are listed
- This widget is a list of properties based on Street address.
- Based on users choice of locality and street, the properties will be listed.

6. Filter option for Locality & Street Name:
- The 2 slicers allow users to filter properties based on Locality and Street Name.
- The count card represents the number of properties based on the set criteria.

C.3. Dashboard for Policy Makers:

Dashboard Widgets
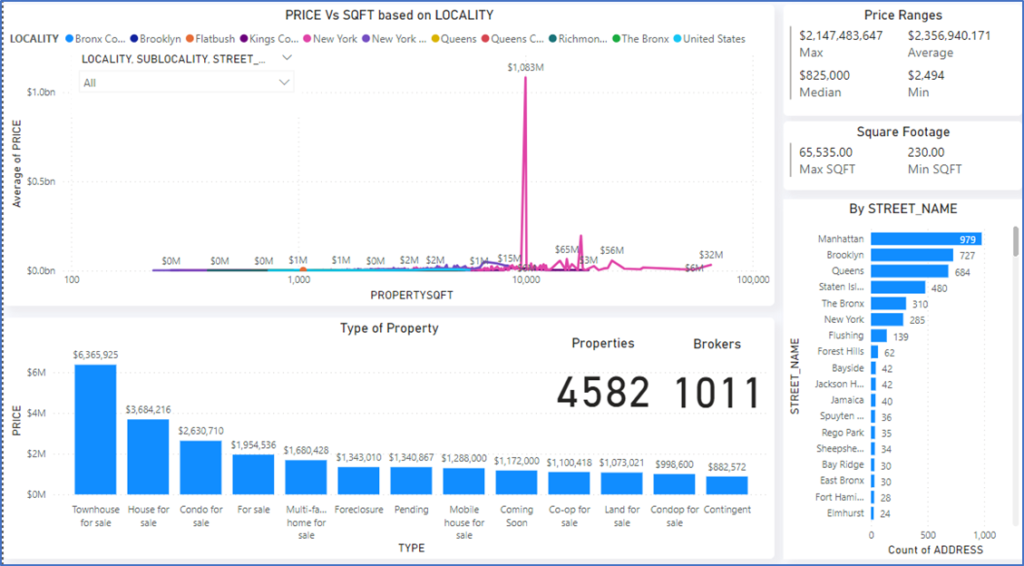
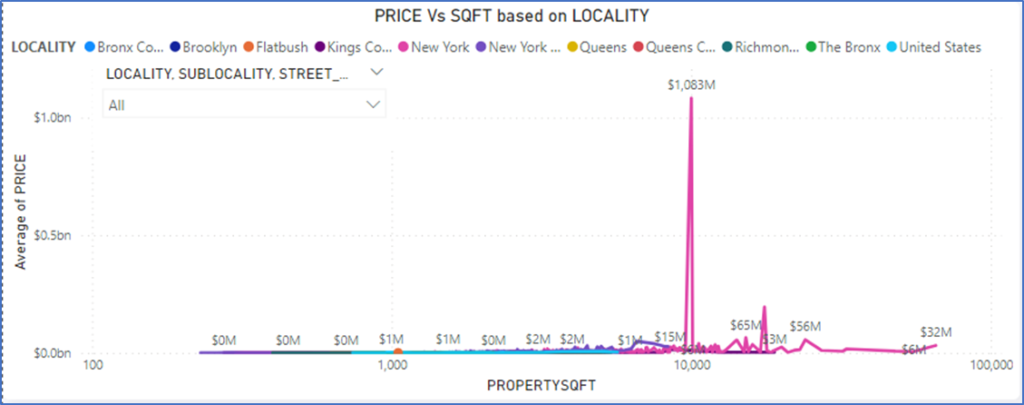
- Price Vs Square Footage based on locality:
- The widget shows the trend of property price by square footage in various locations
- User can select the location using the slicer drop down and the widget shows the price trends.

2. Type of property:
- The widget shows a histogram which displays the price of different types of property.
- 2 small card widgets are also grouped into this widget which shows the total count of Properties and total count of Brokers.

- Price Range Card:
- This widget shows the Maximum, Average, Median and Minimum price of properties.
- The slicer selection allows users to select locality and accordingly filter the price range cards.

- Square Footage Card:
- This widget shows the Maximum, Average, Median and Minimum price of properties.

- Property count by Street Name:
- This widget represents the concentration of properties by Street Name.

