A. Planning
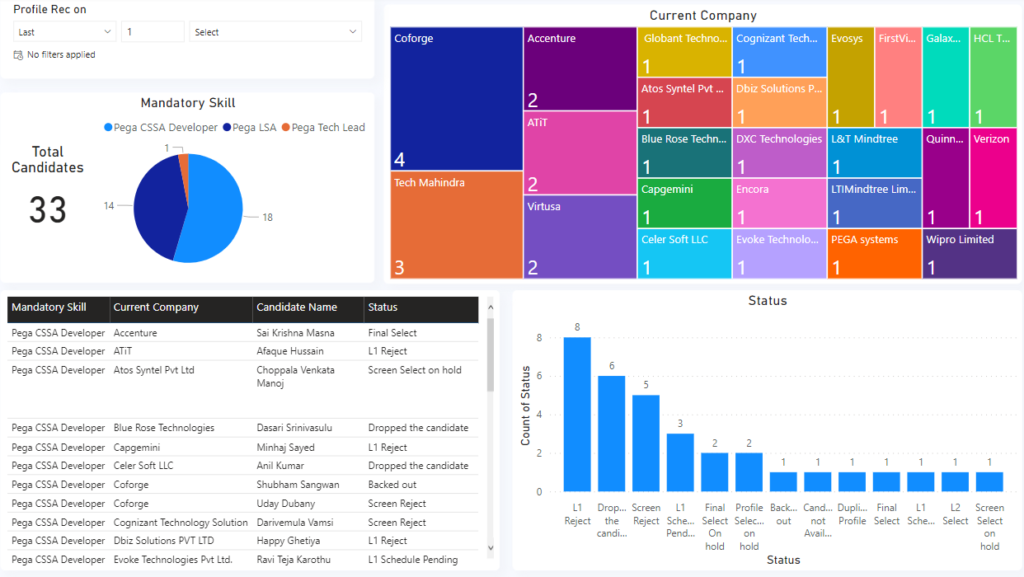
The above dashboard is used to visualize the hiring data with the HR department. The dashboard represents the split up of potential candidates in terms of mandatory skill sets, previous companies where they worked and the current stage in the hiring process. This dashboard will help users identify the status of open positions and the ideal candidates who have been selected to fill them.
B. Business Users
The typical business users are the members of the HR team who are tasked with identifying suitable candidates for the open positions.
C. Widgets
- Split up pie chart of candidates: This Pie chart represents the split up of candidates based on the mandatory skillsets.
- Tile chart: Represents visually the previous companies from whether the candidates are coming from. This helps recruiters identify compatible firms from where suitable candidates can be contacted.
- Status Bar chart: this diagram shows a bar chart which represents the status of candidates at each step in the hiring process. This allows HR managers to identify priority areas where they must deploy more members from the HR team.
- Candidate Table: This table represents the candidate detail such as he previous firm, the current status in the hiring process and the mandatory skill for which they are being considered for.
