A. Planning
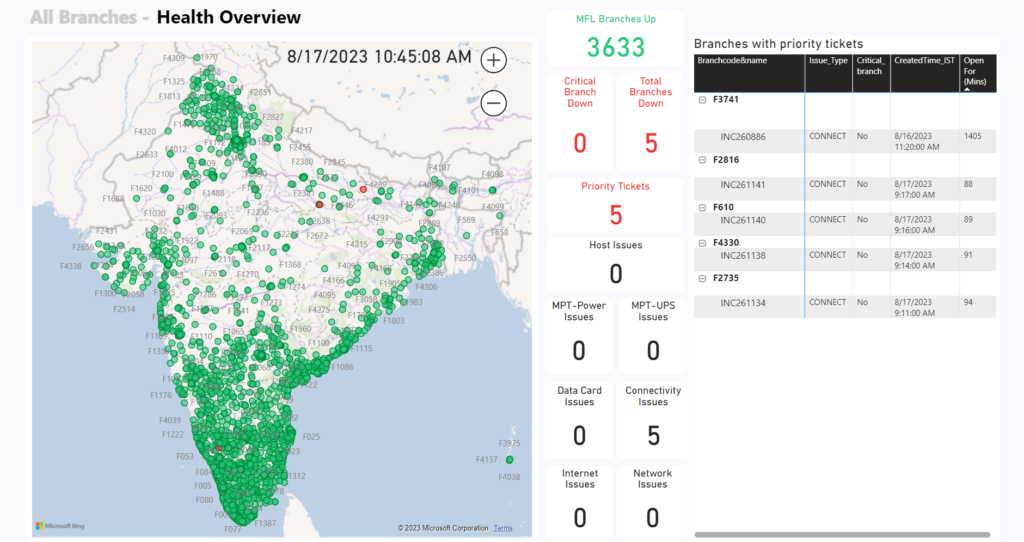
The above dashboard monitors the status of branches of an organization spanning across India. The dashboard highlights any branches with issues and also represents the type of issue. Details about the issue along with the details about the ticket raised to address the issue is listed on the right side.
Out of all the branches, there are few branches which are critical. The status of critical branches are also highlighted in the dashboard with a dedicated page just for critical branch status.
B. Business Users
- NOC Engineers: The typical target users to such a dashboard are the network operations engineers who monitor the health of branches and proactively resolves any issues before it escalates to bring the branch down.
- Zonal Managers: The zonal managers also keep an eye on the branch health ensuring business continuity. The dashboard gives insights into the branches with issues, the type of issues and the duration since the beginning of the particular issue.
C. Widgets
- Geographic Map based display of branches: The visualization of branches based on their location on the map helps users identify any geographic factors influencing the branch health.
- Critical Branches Down: The card represents the number of critical branches that are down.
- Issue Cards: The card widget represents the number of open tickets from each type of issue
- Table widget: Shows the details regarding each ticket that is open, such as branch code, issue type, created time and duration.
